Categories
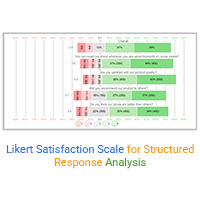
Discover what a Likert Satisfaction Scale is, its structure, and why it’s used in customer and employee feedback surveys.
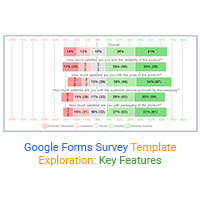
Google Forms survey templates make it easy to design surveys fast. Discover their benefits, examples, and how to personalize them for your needs.
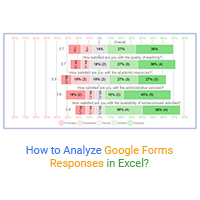
Learn how Google Forms responses work, where to find them, and how to organize results in spreadsheets for easier analysis.